|
You are looking
at a quite simple plot of time series. The values on the vertical
axis inform about the fraction of a country (Poland in this case)
is currently covered with snow. Instead of absolute units (square
kilometres) a relative value is given, which is the percentage of
a country territory. The scale is simple: 0% means now snow at all,
while 100% the whole country under snow cover. The horizontal axis
represents time, i.e. the consecutive days of a year, starting July
1 and ending June 30. The New Year falls exactly in the middle of
the plot and is marked with a continuous vertical line. Vertical
dashed lines indicate the first day of each month.
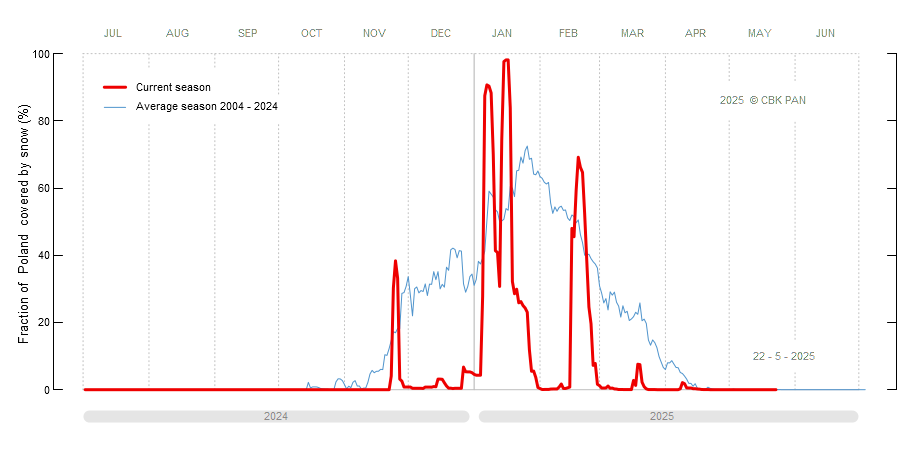
The plot shows
two lines. The red line represents the extent of the snow cover
in the current season. Information is daily updated. The most recent
value (right-most) informs about the snow cover 1-2 days ago.
Delay is caused by the time needed for data analysis. The blue line
in the background of the plot indicates the average snow cover for
given day, based on climatological data (winters since 2004, excluding
the current season).
The average
may serve as a reference point for the interpretation of the line
for the current season - indicates whether the presence of snow
cover, and its coverage at any given time are unusual, or typical.
For example, the blue line shows that snow cover appears in Poland
first in the middle of October, and is noted until the end of April.
However, the greatest probability of snow cover occurrence in Poland
is in January and February. Nevertheless, one should not expect
snow in the period from May to September (except for the mountains).
The graphs
show only the snow cover presence, without specifying its depth.
On the map and plots the snow cover is marked it the same way, despite
being 1 cm depth or 100 depth. This is due to the nature of the
optical remote sensing of snow.
|