 Wersja polska
 English version
Analysis of the surface of the solar system bodies with the use of mathematical morphology techniques
Task: Remote Sensing Analysis of Landforms in Isidis Planitia, Mars In 2018, the project’s goal and scope were determined, namely: to develop a semi-automatic algorithm to analyse characteristic landforms in Isidis Planitia on Mars.
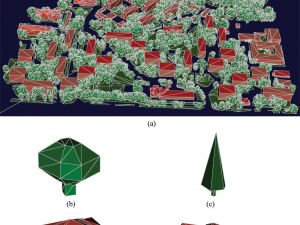
Wajer P., Woźniak E., Kofman W., Rybicki M., Lewiński S. (2018) Simulation of SAR images of urban areas by using the ray tracing method with measured values of backscatter coefficients, International Journal of Remote Sensing, 39:9, 2671-2689, doi: 10.1080/01431161.2018.1430396
This study uses the ray tracing method to simulate synthetic aperture radar (SAR) images of urban areas. The images are constructed for polarisations: horizontal-horizontal (HH) and vertical-vertical (VV), and different types of buildings, vegetation,
Kukawska E. et al. (2017) Multitemporal Sentinel-2 data – remarks and observations. 9th International Workshop on the Analysis of Multitemporal Remote Sensing Images (MultiTemp), Brugge, 2017, pp. 1-4, doi: 10.1109/Multi-Temp.2017.8035212
All the pre-processing algorithms are being improved constantly. The biggest challenge for the multitemporal analysis is to deal with errors caused directly by the chain of pre-processing of raw Sentinel-2 data to the level
LiRa-C
Seen from the ground, clouds come in a wide variety of shapes and sizes; faces, animals, plants – the only limit is the observer’s imagination. However, climatologists only distinguish ten generic types, divided into
Lewiński S., Nowakowski A., Malinowski R., Rybicki M., Kukawska E., Krupiński M. (2017) Aggregation of Sentinel-2 time series classifications as a solution for multitemporal analysis. In Proc. SPIE 10427, Image and Signal Processing for Remote Sensing XXIII, 104270B doi: 10.1117/12.2277976
The general aim of this work was to elaborate efficient and reliable aggregation method that could be used for creating a land cover map at a global scale from multitemporal satellite imagery. The study
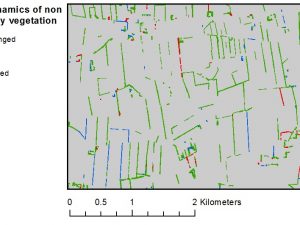
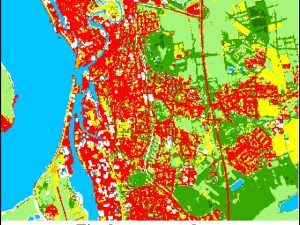
Angelidis I., Levin G., Díaz-Varela R. A., & Malinowski R. (2017) Assessment of changes in formations of non-forest woody vegetation in southern Denmark based on airborne LiDAR. Environmental Monitoring and Assessment, 189(9), 437, doi: 10.1007/s10661-017-6119-8
LiDAR (Light Detection and Ranging) is a remote sensing technology that uses light in the form of pulses to measure the range between a sensor and the Earth’s surface. Recent increase in availability of
Evaluation of the usefulness of multifractal formalism in the processing and analysis of optical remote sensing images
The rapid development of the satellite systems and airborne measurements generates significant increase of the amount of collected observational data about our planet. This forces the improvement of existing and the development of new
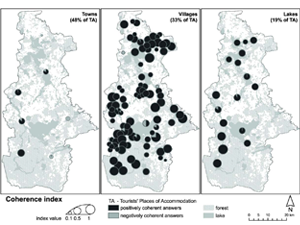
Derek M., Woźniak E., Kulczyk S. (2017) Tourism in a nature-based destination: the human versus the ecological perspectives, Tourism Geographies, 10.1080/14616688.2017.1314545
In the tourism studies literature, wilderness has been addressed from two perspectives. From the first, human, perspective wilderness is a social, subjective construction that exists only in the mind of its users. From the
Malinowski, R., Groom, G.B., Heckrath, G. (2017) Do Remote Sensing Mapping Practices Adequately Address Localized Flooding? A Critical Overview, et al. Springer Science Reviews, doi: 10.1007/s40362-017-0043-8
Local-scale flooding (LSF) is usually characterized by much less severe damage compared to extreme flood events; however, it does have marked local environmental influence, especially when it is characterized by regular and frequent occurrence
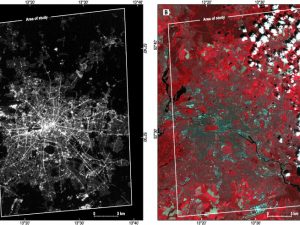
Kotarba A.Z., Aleksandrowicz S. (2016) Impervious surface detection with nighttime photography from the International Space Station. Remote Sensing of Environment Volume 176, April 2016, Pages 295-307, doi: 10.1016/j.rse.2016.02.009
For over two decades nighttime satellite imagery from the Operational Linescan System (OLS) has been used to detect impervious surfaces. However, OLS-based maps suffer from the sensor’s coarse resolution (2.7 km/pixel), overglow, and saturation in